BioRender Alternatives: Scientific Illustration Software Comparisons
Learn More About Simplified Science PublishingComparison of BioRender and other popular scientific illustration software costs, pros, and cons.
Every year, scientists create posters, presentations, and figures that use images to help communicate the methods and results of their research. Organizing images and creating quality data visualizations are essential skills that are often overlooked in graduate school training. This article provides detailed information to help researchers decide which tools they want to use to create their own impressive science drawings.
Science Illustration Tool Comparisons
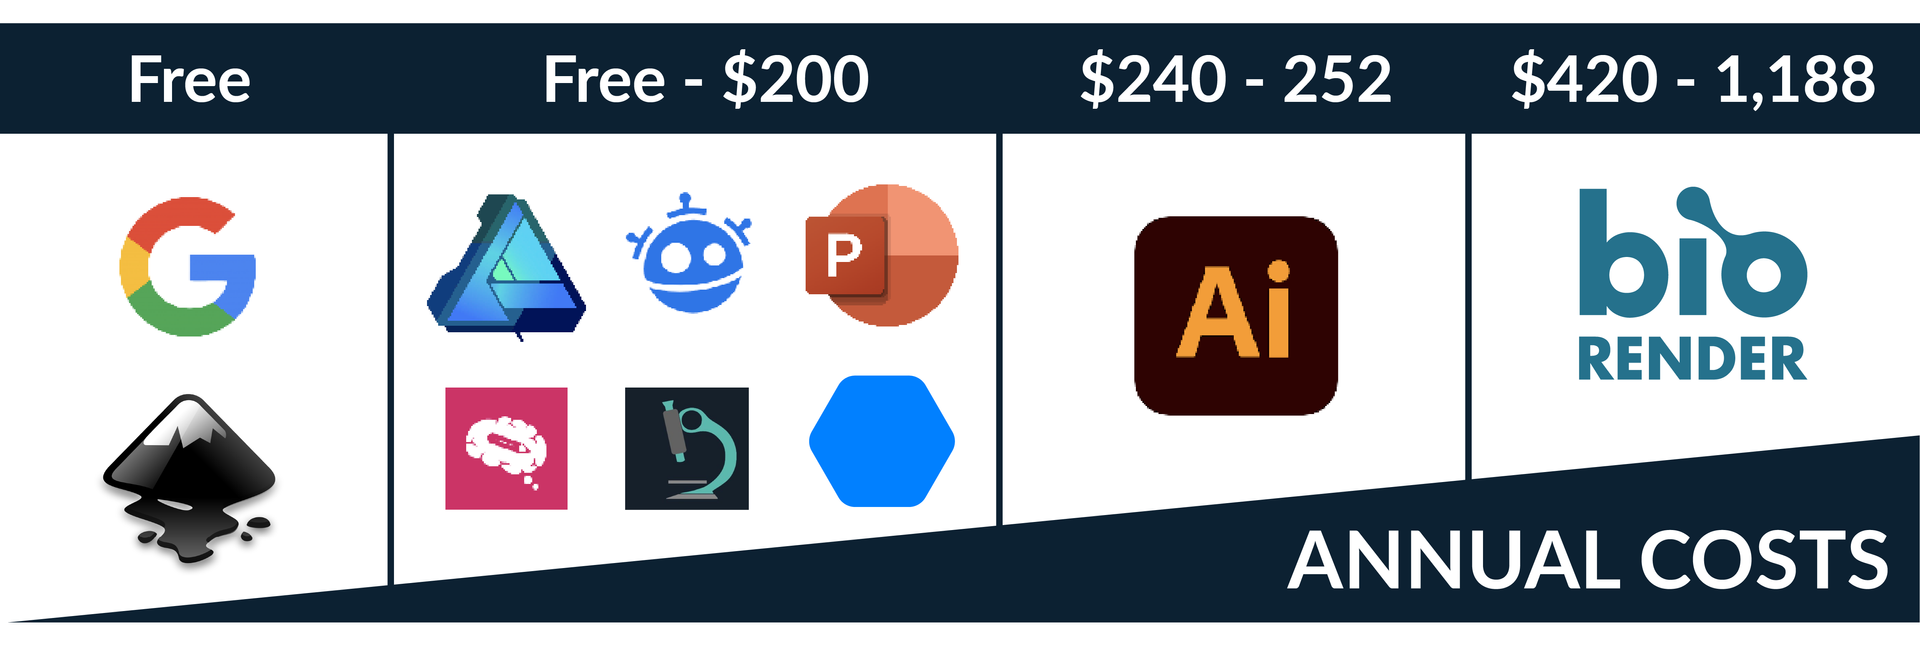
There are an increasing number of software options available for researchers to use to create their scientific figures and graphical abstracts. The chart below compares the pros, cons, and costs of the most commonly used design tools. The annual costs are calculated for versions that include access to high-resolution exports of the final images and scientific designs.
| Illustration Software | Pros | Cons | Annual Cost (USD) |
|---|---|---|---|
| BioRender | Large high quality image and template database | Cost, training time, limited customization | $420 — $1,188 |
| Image Databases | Low cost and good customization options | Time to download and arrange images | Free — $200+ |
| Affinity Designer | Low cost and good customization options | Training time | $69.99 *One time payment |
| Adobe Illustrator | Advanced tools and full customization | Cost and training time | $239.88 — $251.88 |
| Inkscape | Low cost | Training time and nonstandard design features | Free |
| PowerPoint | Easy to use and collaborate with others | Limited design options | Free — $69.99 *One Time Payment |
| Google Slides and Google Drawing | Low cost and easy to use | Limited design options | Free with Google account |
BioRender
Annual Cost: $420 - 1,188
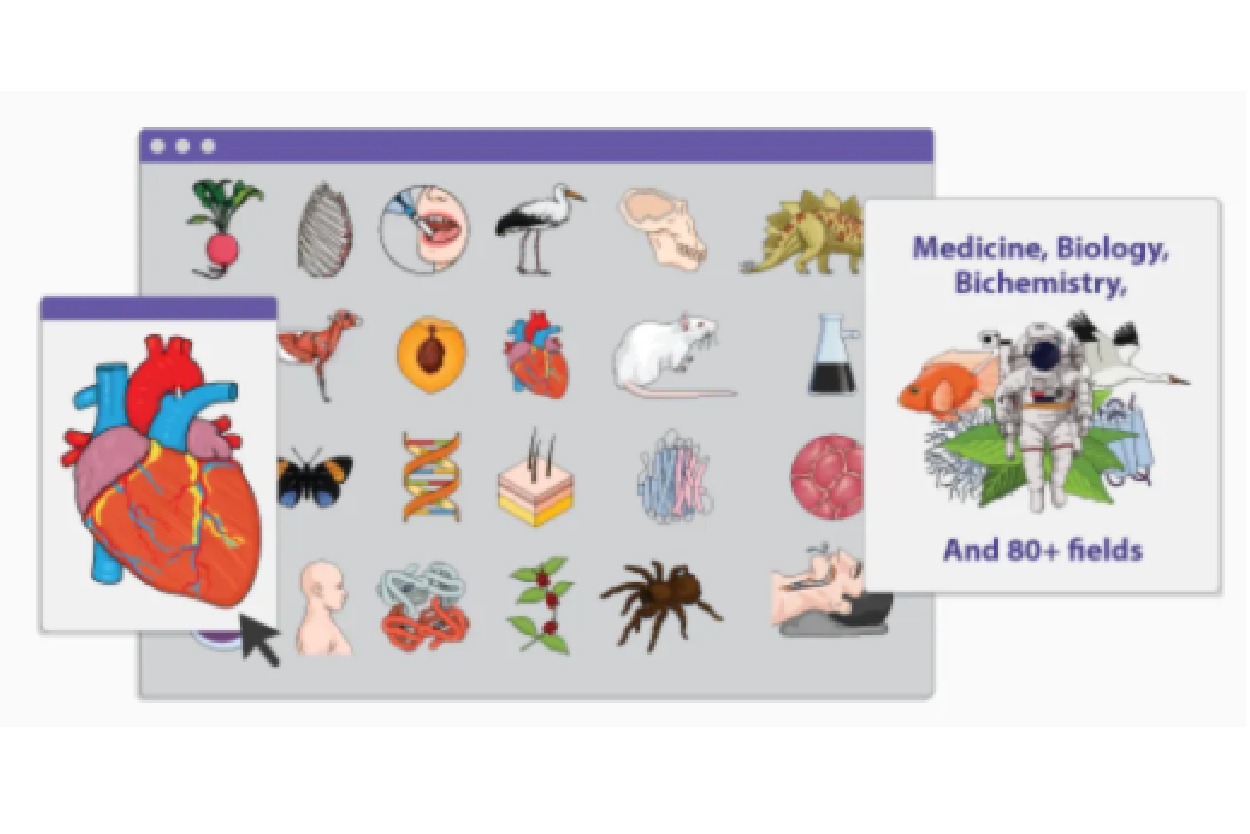
BioRender is a high quality image database and design tool that allows researchers to arrange standardized scientific images into attractive illustrations that can be used in scientific figures, graphical abstracts, posters, and presentations. It has been a fantastic tool that has expanded scientists' ability to quickly communicate their research.
However, the downside to this tool is the high cost for high resolution downloads that are required for publications, the lack of customization options, and the fact that it requires you to learn how to format your designs within their own software before exporting the images. This can make it challenging to format the final scientific figures and is limiting when you want to customize the designs to highlight your specific results or methods. Learn more about the BioRender Alternatives below.New Paragraph
Download Images and Templates
Annual Cost: Free - $200+
One cost-effective way to create your own designs is to download high-resolution vector images that you can use to customize your scientific graphics. This requires that you search image databases to find designs that are relevant for scientific use and do not have copyright/licensing restrictions that require attribution or limit customization. Below is a list of image databases that I recommend using for scientific purposes and you can also read this guide on how to find the right kind of science images in Google search.
Freepik
- Website: https://www.freepik.com/popular-vectors
- Good vector image options for open use and customization with and without attribution required
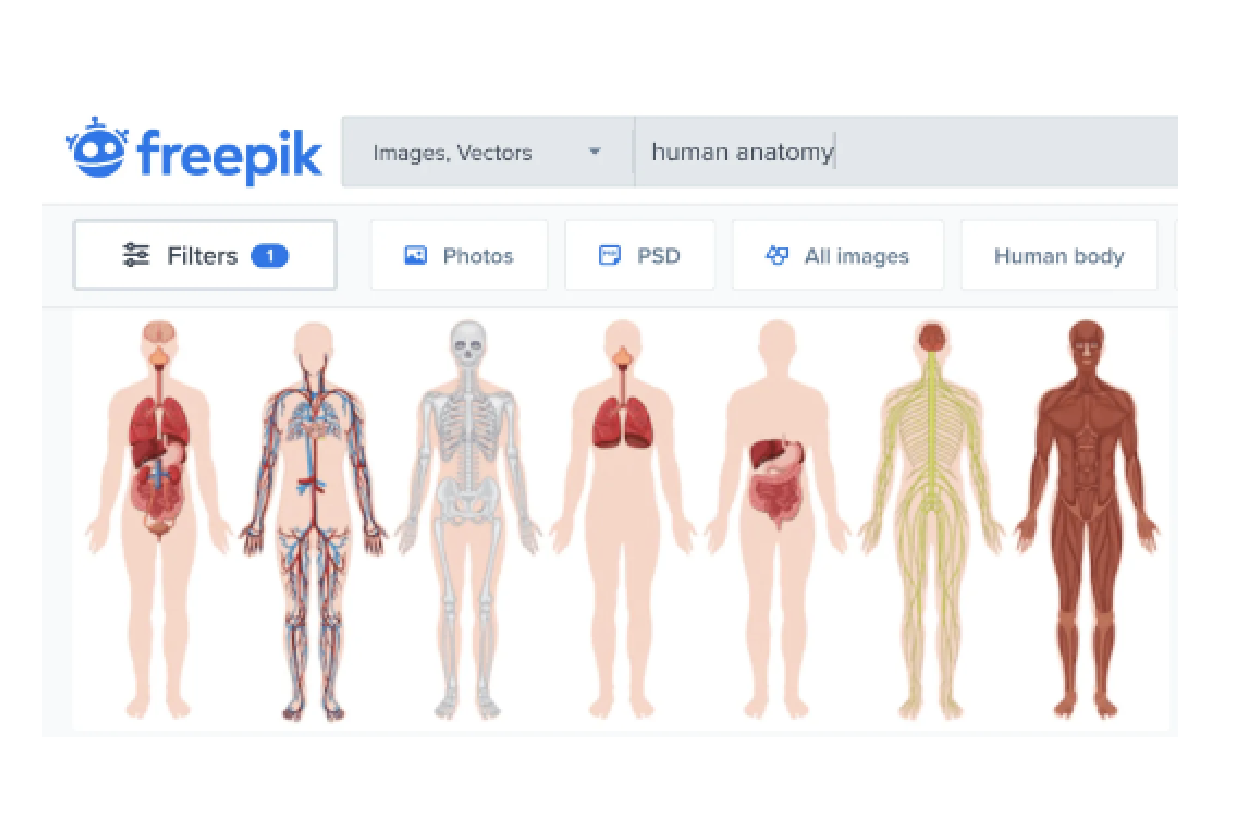
- Especially good for human anatomy and organ vectors
- Requires subscription for large numbers of premium downloads
- Cost: Free downloads, monthly subscription is $24 per month and full year subscription is $144
Simplified Science
- Website: https://www.simplifiedsciencepublishing.com/science-images/
- Professional vector image options for open use
- Images for publications without attribution required
- Fully customizable downloads with Adobe Illustrator, SVG, and PNG formats
- Especially good for graphical abstracts, research methods, biological diagrams, and scientific posters
- No subscription required and includes online courses
- Cost: Free downloads, $2 for individual images, and $9+ for larger image bundles
Scientific Drawing Software
In order to edit downloaded images or if you want to create your own custom designs, the next step you need to take is to learn to use digital drawing software. If you are a researcher who wants to improve your science communication skills, I strongly recommend learning how to incorporate the images into your own custom designs using one of the software programs listed below.
Adobe Illustrator
Annual Cost: $240 - 252
Adobe Illustrator is considered the gold standard design software for scientists and graphic designers. This extensive design tool allows you to create impressive digital illustrations, figures, and posters. The downside to Adobe Illustrator is high cost and the fact that it takes time and practice to use the software efficiently. However, many scientists choose to invest in this software because it is considered the best professional tool for research-related designs. Learn more about how to get Adobe Illustrator.

Affinity Designer
Annual Cost: $$69.99 (One-Time Purchase)
Affinity Designer is an affordable option that has comparable tools and functions to Adobe Illustrator, but for one low price. You can open and edit Adobe Illustrator files within Affinity Designer and it is becoming an increasingly popular option for scientists who do not want to pay for the recurring annual costs of other tools. It still requires time to learn how to use it, but the software is intuitive if you already know how to use Adobe Illustrator. Visit https://affinity.serif.com/en-us/designer/ to learn more.
PowerPoint
Cost: Free, $70 for single software, or $149 for Entire Microsoft Office Suite (One-Time Purchase)
PowerPoint is another affordable tool that is already widely used by the scientific community. The design features are limited compared to Adobe Illustrator and Affinity Designer, but it still has great options for customizing downloaded images, arranging scientific figures, and creating basic graphic designs for graphical abstracts and posters. I recommend buying the latest one-time Microsoft Office suite (~$149 USD for the 2021 option) and I do not recommend wasting your money on the 365 subscription. Learn more about how to get PowerPoint on your computer here.

Inkscape
Annual Cost: $Free
Inkscape is a free design program that allows you to arrange images and create custom designs. Although this software allows you to save on costs, it still requires time to learn how to use the platform effectively and has fewer design options that other tools. Because of the training time required, I recommend that you spend time increasing your skills with other design tools that are more commonly used in the research industry such as Adobe Illustrator, Affinity Designer, or PowerPoint. Visit https://inkscape.org/ to learn more.

Google Slides and Google Drawing
Annual Cost: Free with Google account
Google Slides and Google Drawing are free programs available if you sign up for a Google account. The Google Slide design options are similar to those of Microsoft PowerPoint and Google Drawing is a new software that allows you to create simple custom designs. These are good free alternatives to the Microsoft Office Suite. Learn how to create a Google Account here: https://support.google.com/accounts/answer/27441?hl=en.
Scientific Illustration Software Summary
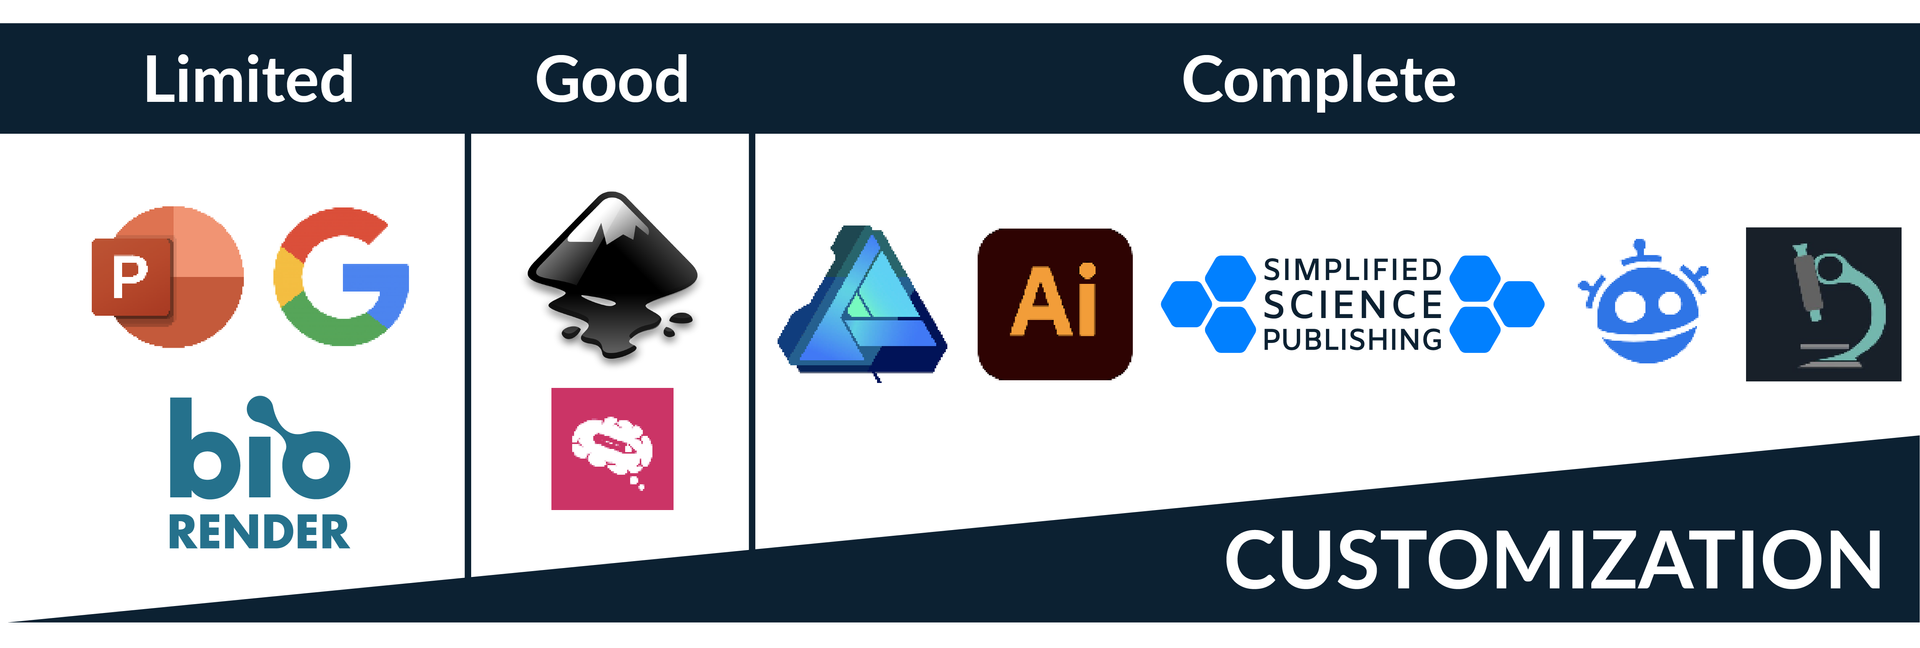
Regardless of which design tools you choose, I hope you learned more about the illustration software available to help you create engaging graphic designs for scientific and public audiences. Below is a summary of the cost and customization options for the science drawing tools reviewed in this article.

Create professional science figures with illustration services or use the online courses and templates to quickly learn how to make your own designs.
Interested in free design templates and training?
Explore scientific illustration templates and courses by creating a Simplified Science Publishing Log In. Whether you are new to data visualization design or have some experience, these resources will improve your ability to use both basic and advanced design tools.
Interested in reading more articles on scientific design? Learn more below:
Content is protected by Copyright license. Website visitors are welcome to share images and articles, however they must include the Simplified Science Publishing URL source link when shared. Thank you!
