
LIVE ONLINE ZOOM WORKSHOP

Adobe Illustrator for Research Applications

One or Two-Day Workshops

*Workshops can be customized to meet your program's unique career development goals

Learn essential design skills for data visualizations, scientific illustrations, and figure designs with this comprehensive course. These effective workshops are perfect for graduate school career development programs that want to provide their graduate students and postdocs with a competitive advantage for successful careers in academia as well as public, private, and nonprofit sectors. Workshop participants will:

  • Learn how to use the most important Adobe Illustrator tools for research applications such as scientific figures, presentations, and posters
  • Get expert tips on how to optimize the color design for their scientific graphs and presentations to improve accessibility and audience engagement
  • Feel confident creating effective data visualizations using Excel and Adobe Illustrator
  • Learn about using the additional tools available for scientific design such as PowerPoint, Affinity Designer, Canva, and Inkscape.
  • Receive a user-friendly Adobe Illustrator Guide PDF with over 70 pages of tool instructions that makes it easy to apply what they learned in the workshop without referring back to notes.
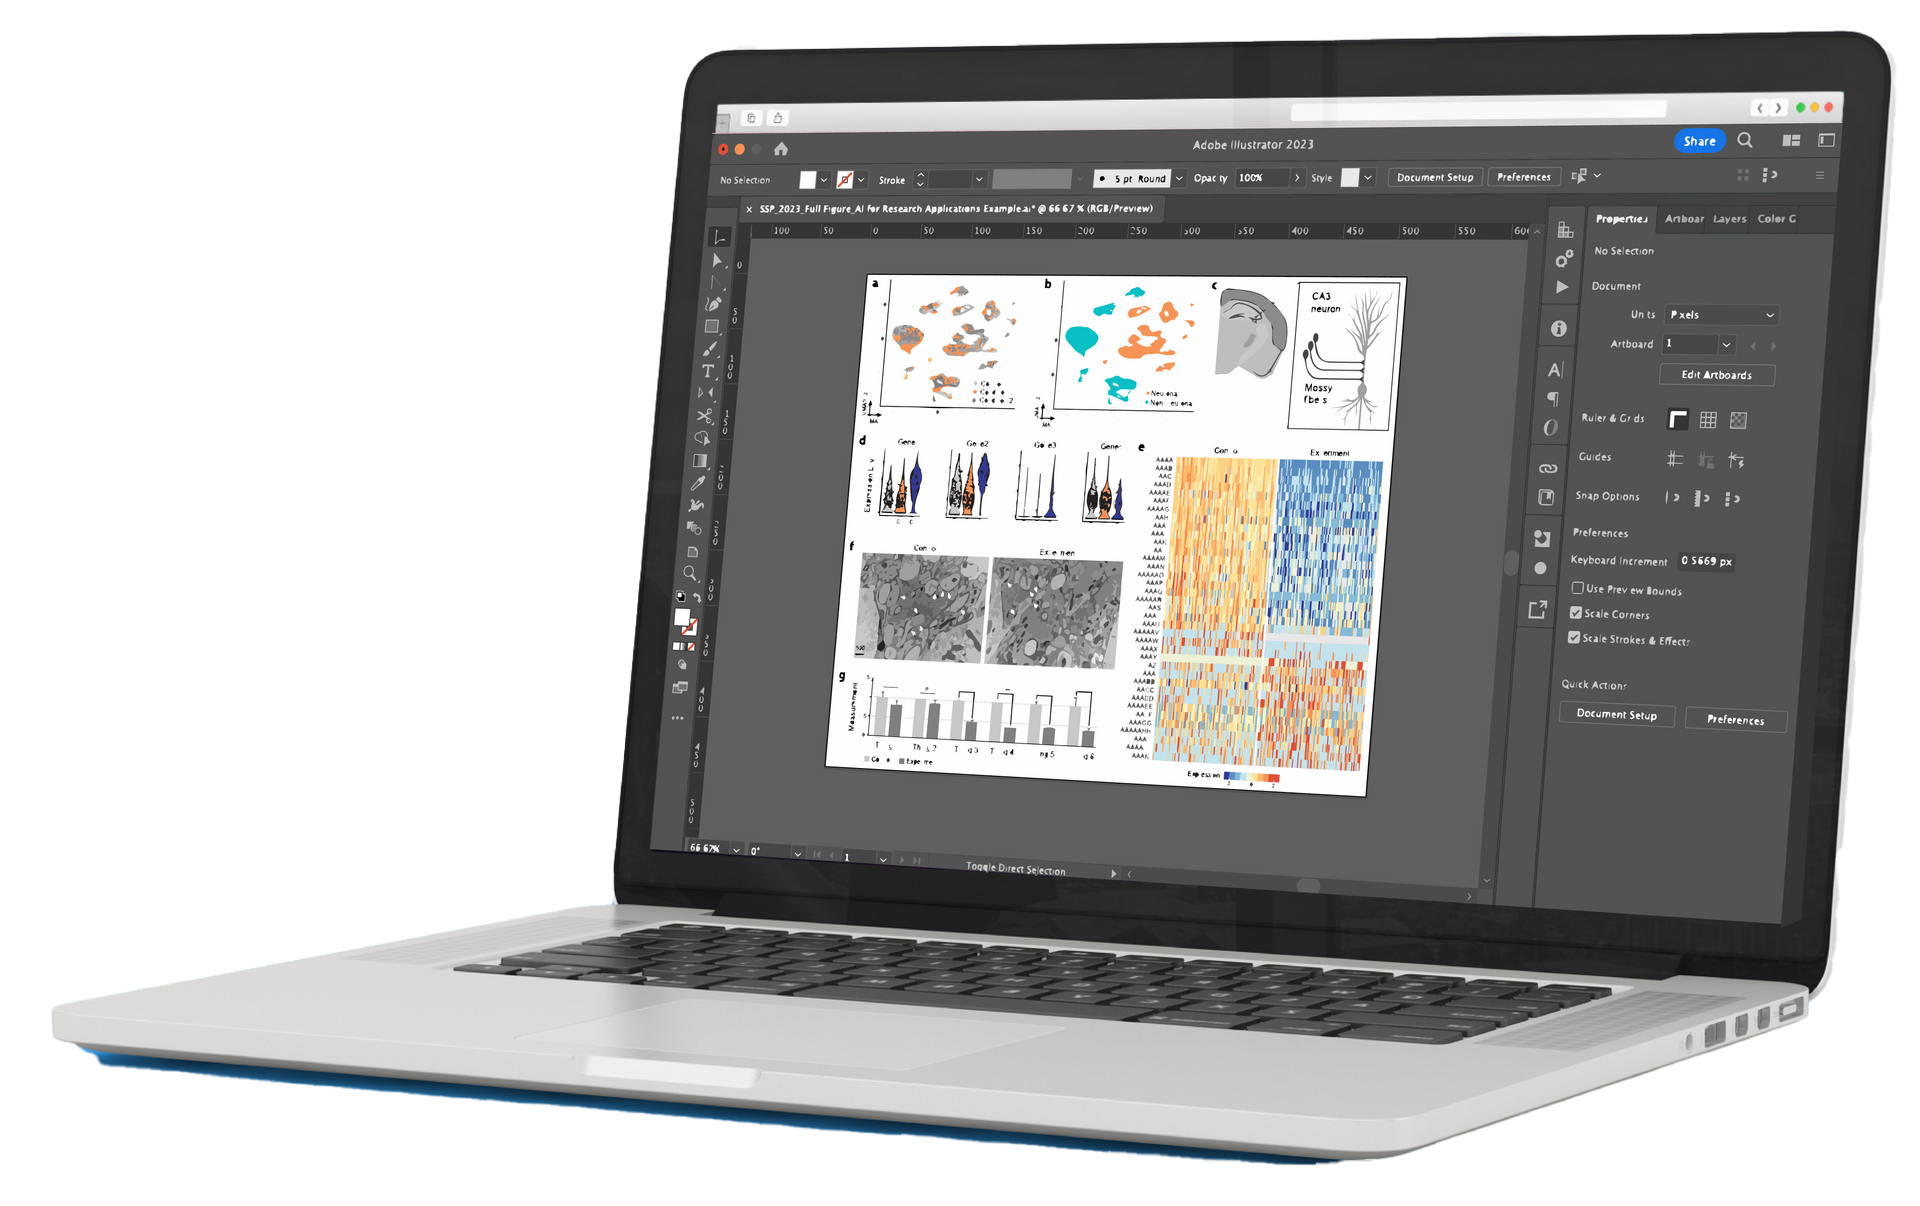
Adobe Illustrator research applications course materials example

Workshop Highlights

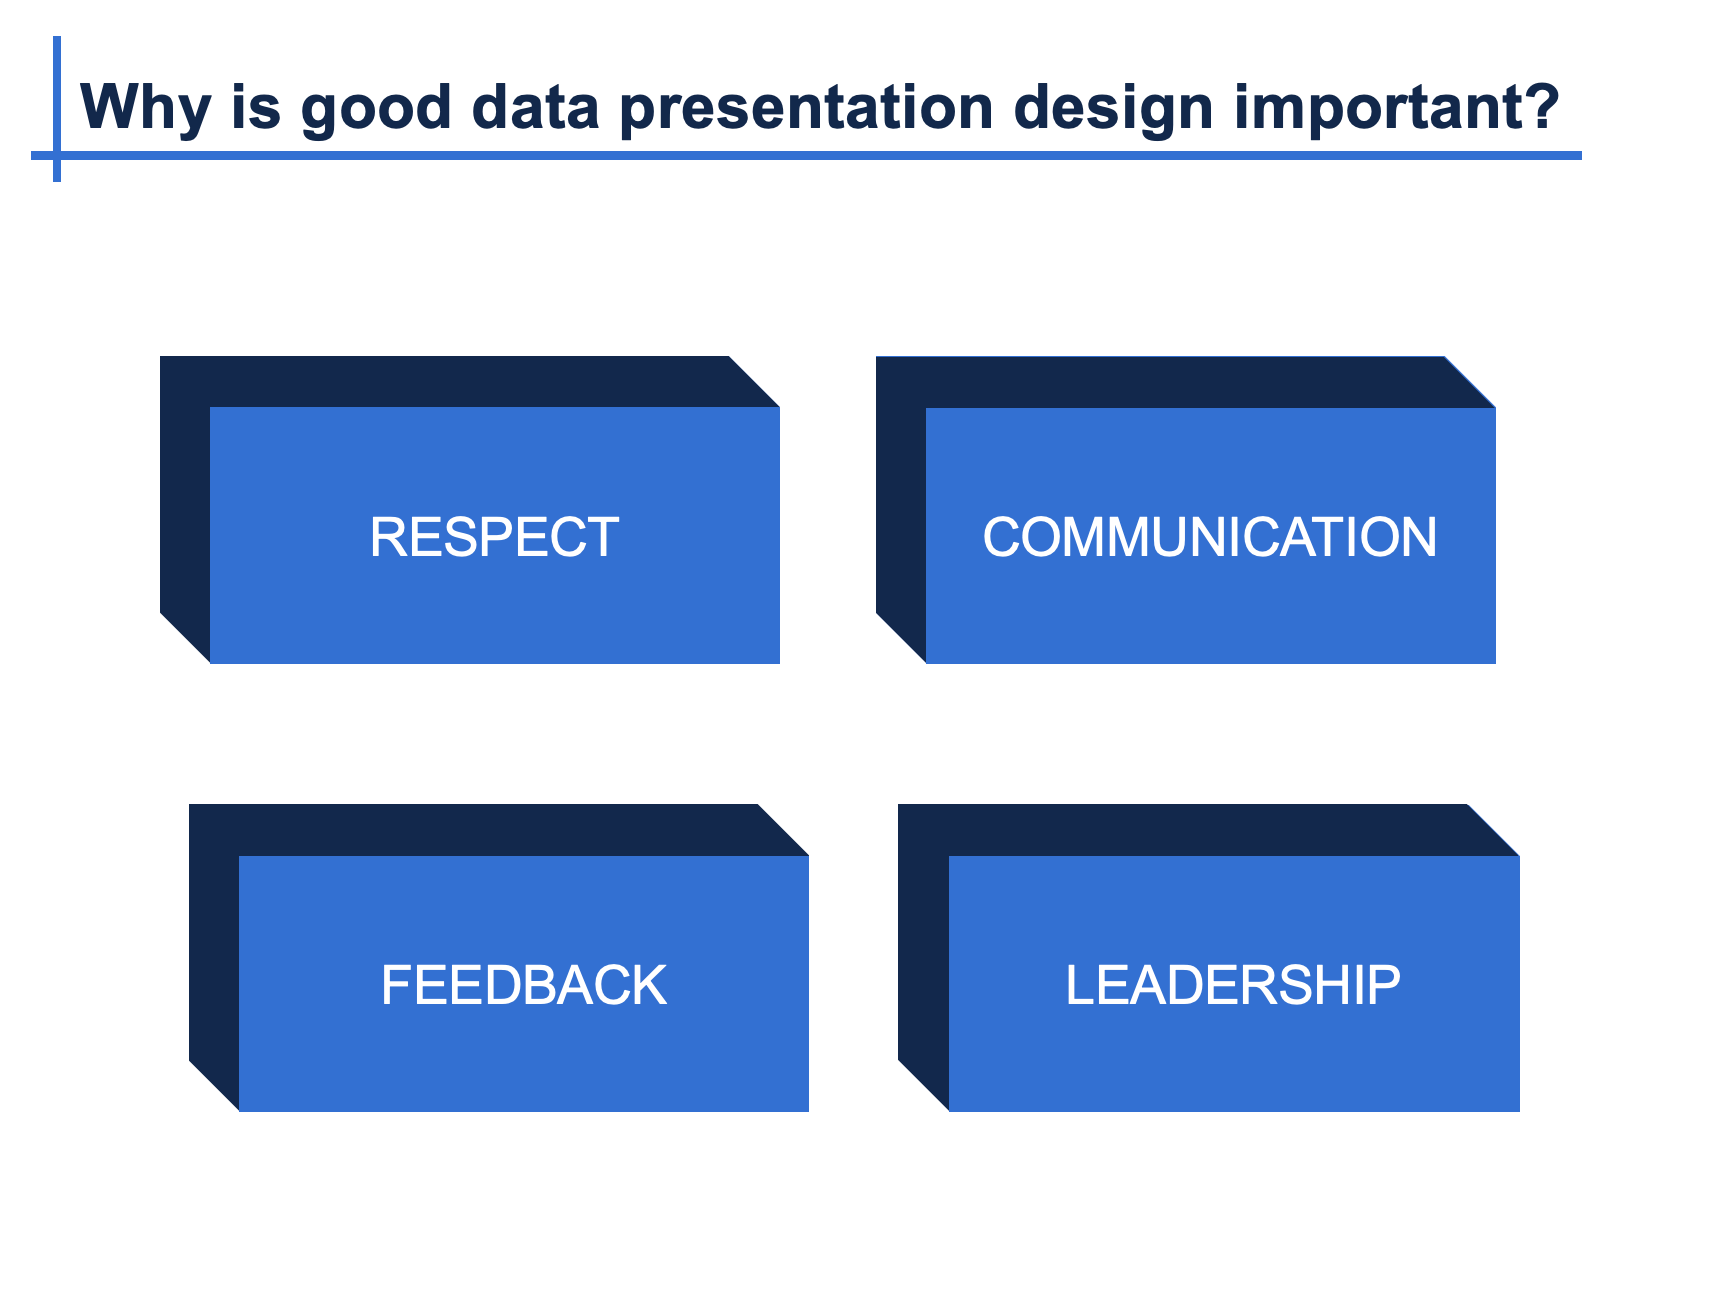
Data presentation design workshop introduction slide

Learning Objectives

By the end of the workshop, participants will be able to:

 • Prepare engaging introductions for data-focused presentations


• Create quick and effective presentation outlines that identify and highlight the main point


• Use essential tools such as space, color, contrast, text and animations within Excel and PowerPoint to create clear data visualizations 


• Design presentations that enhance audience attention and comprehension


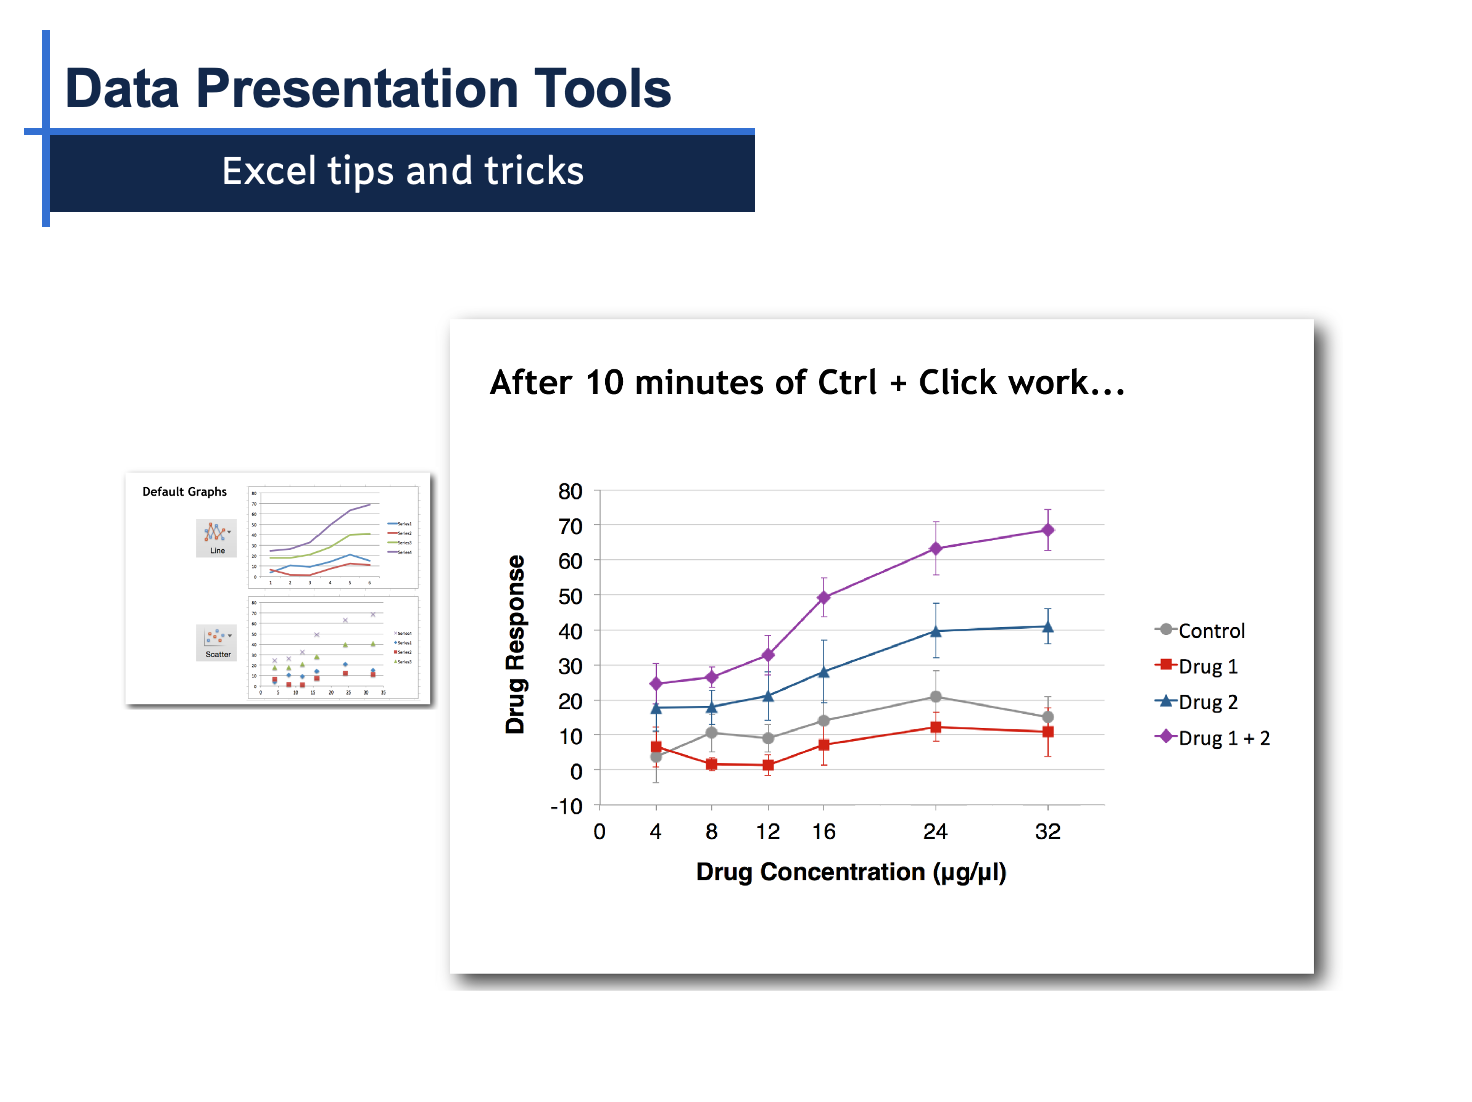
Excel graph optimization example from the workshop

Workshop Overview

Part 1. Engage your audience: Learn scientifically proven methods to earn your audience's attention and improve their comprehension.


Part 2. Identify and Illustrate Your Main Point 

Guided exercises to design an engaging data presentation that effectively communicates the main point that you want the audience to adapt.


Part 3. Data Visualization and Slide Design

  • Space, contrast, color, text, images, animations, and data visualizations.
  • Excel and PowerPoint tips and tricks: shortcuts, templates, alignment, groups, arrangement, crops and shapes.
  • Introduction to additional presentation and data visualization tools
Adobe Illustrator logo

Learning Objectives

By the end of the workshop, participants will be able to:

 • Be familiar with the most common tools and techniques used for research applications in Illustrator


• Create their own figures in Adobe Illustrator with images, illustrations, and Excel graphs


• Design scientific visuals that enhance audience attention and comprehension


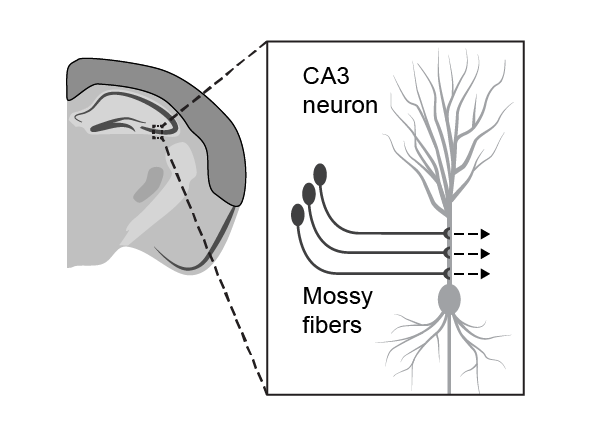
Scientific illustration example from workshop

Introduction to Adobe Illustrator and Scientific Design Tools


• Course introduction and how to use the Adobe Illustrator Guide PDF


• Adobe Illustrator tools, properties, and workspace setup overview


• Adobe Illustrator for research applications and scientific figures:

  • Excel graphs
  • PDF output from graphing software
  • Scientific images
  • Scientific illustrations
  • How to format final figures and export files


• Learning Lab homework using practice files or your own graphs/figures


• Review of additional software tools for scientific design such as PowerPoint, Affintiy Designer, Inkscape, and Canva


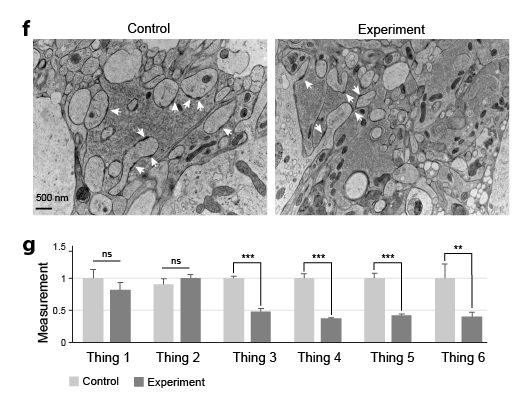
Scientific microscope image and excel graph example from workshop

Illustrator Learning Lab


• Question and answer Learning Lab for the practice files or your own graphs/figures


• Research application design tutorials:

  • Data visualization design best practices
  • Color design tips and tricks
  • Research posters and Adobe Illustrator print settings


• Ethical use of downloaded images/illustrations

Workshop Highlights

Adobe Illustrator logo

Learning Objectives

By the end of the workshop, participants will be able to:

 • Be familiar with the most common tools and techniques used for research applications in Illustrator


• Create their own figures in Adobe Illustrator with images, illustrations, and Excel graphs


• Design scientific visuals that enhance audience attention and comprehension


Workshop scientific illustration example using Adobe Illustrator

Design Skills

Adobe Illustrator Tips & Tricks


• Course introduction and how to use the Adobe Illustrator Guide PDF


• Adobe Illustrator tools, properties, and workspace setup overview


• Adobe Illustrator for research applications and scientific figures:

  • Excel graphs
  • PDF output from graphing software
  • Scientific images
  • Scientific illustrations
  • How to format final figures and export files


• Learning Lab homework using practice files or your own graphs/figures


• Review of additional illustration software tools that are available.


Scientific microscope image and graph example from workshop

Workshop Lab

Adobe Illustrator Learning Lab


• Question and answer Learning Lab for the practice files or your own graphs and figures


• Research application design tutorials (as time allows):

  • Data visualization design best practices
  • Color design tips and tricks
  • Research posters and Adobe Illustrator print settings


• Ethical use of downloaded images/illustrations

Proud to have led in-person and online workshops for:

Karen Thiebes course instructor photo

Course Instructor

Dr. Karen Thiebes is a professional scientific illustrator and has a Ph.D. in Neuroscience. She has led scientific design courses for over 8 years and enjoys teaching participants how to quickly transform data into effective designs using Affinity, Adobe Illustrator, PowerPoint, and Excel. She is also an Affinity Education Leader who supports improving accessibility to design software and training for everyone.

Workshop Pricing & Request Form


Online Zoom Workshop Rates

  • 1 hour workshop: $600 USD
  • 2 hour workshop: $800 USD
  • 3 hour workshop: $1,000 USD
  • 4 hour half-day workshop: $1,200 USD


*In-person daily workshop rates are the same as listed above with travel costs included as a separate fee.


Contact Us

Access All Advanced Online Courses

Simplified Science Pro users receive unlimited access to all of the free and advanced courses for only $59. New online courses are added every year to stay up-to-date with the latest scientific design techniques and includes access to live trainings called Adobe Illustrator Learning Labs. The Pro courses also include scientific templates such as the popular Biological Diagram and Laboratory Tool templates with over 400 illustrations that you can use in your own scientific designs. Learn more here!