Get in touch
555-555-5555
mymail@mailservice.com


Adobe Illustrator for Scientists
Everything you need to know to make scientific illustrations and data visualizations
Equip yourself with the skills to create your own scientific illustrations, figures, graphs, and tables with beginner-friendly lessons and practical examples. In this course, you will:
- Learn how to use Adobe Illustrator tools and shortcuts
- Download an easy-to-use Adobe Illustrator Guide with click-paths for every scientific design technique shown in the course
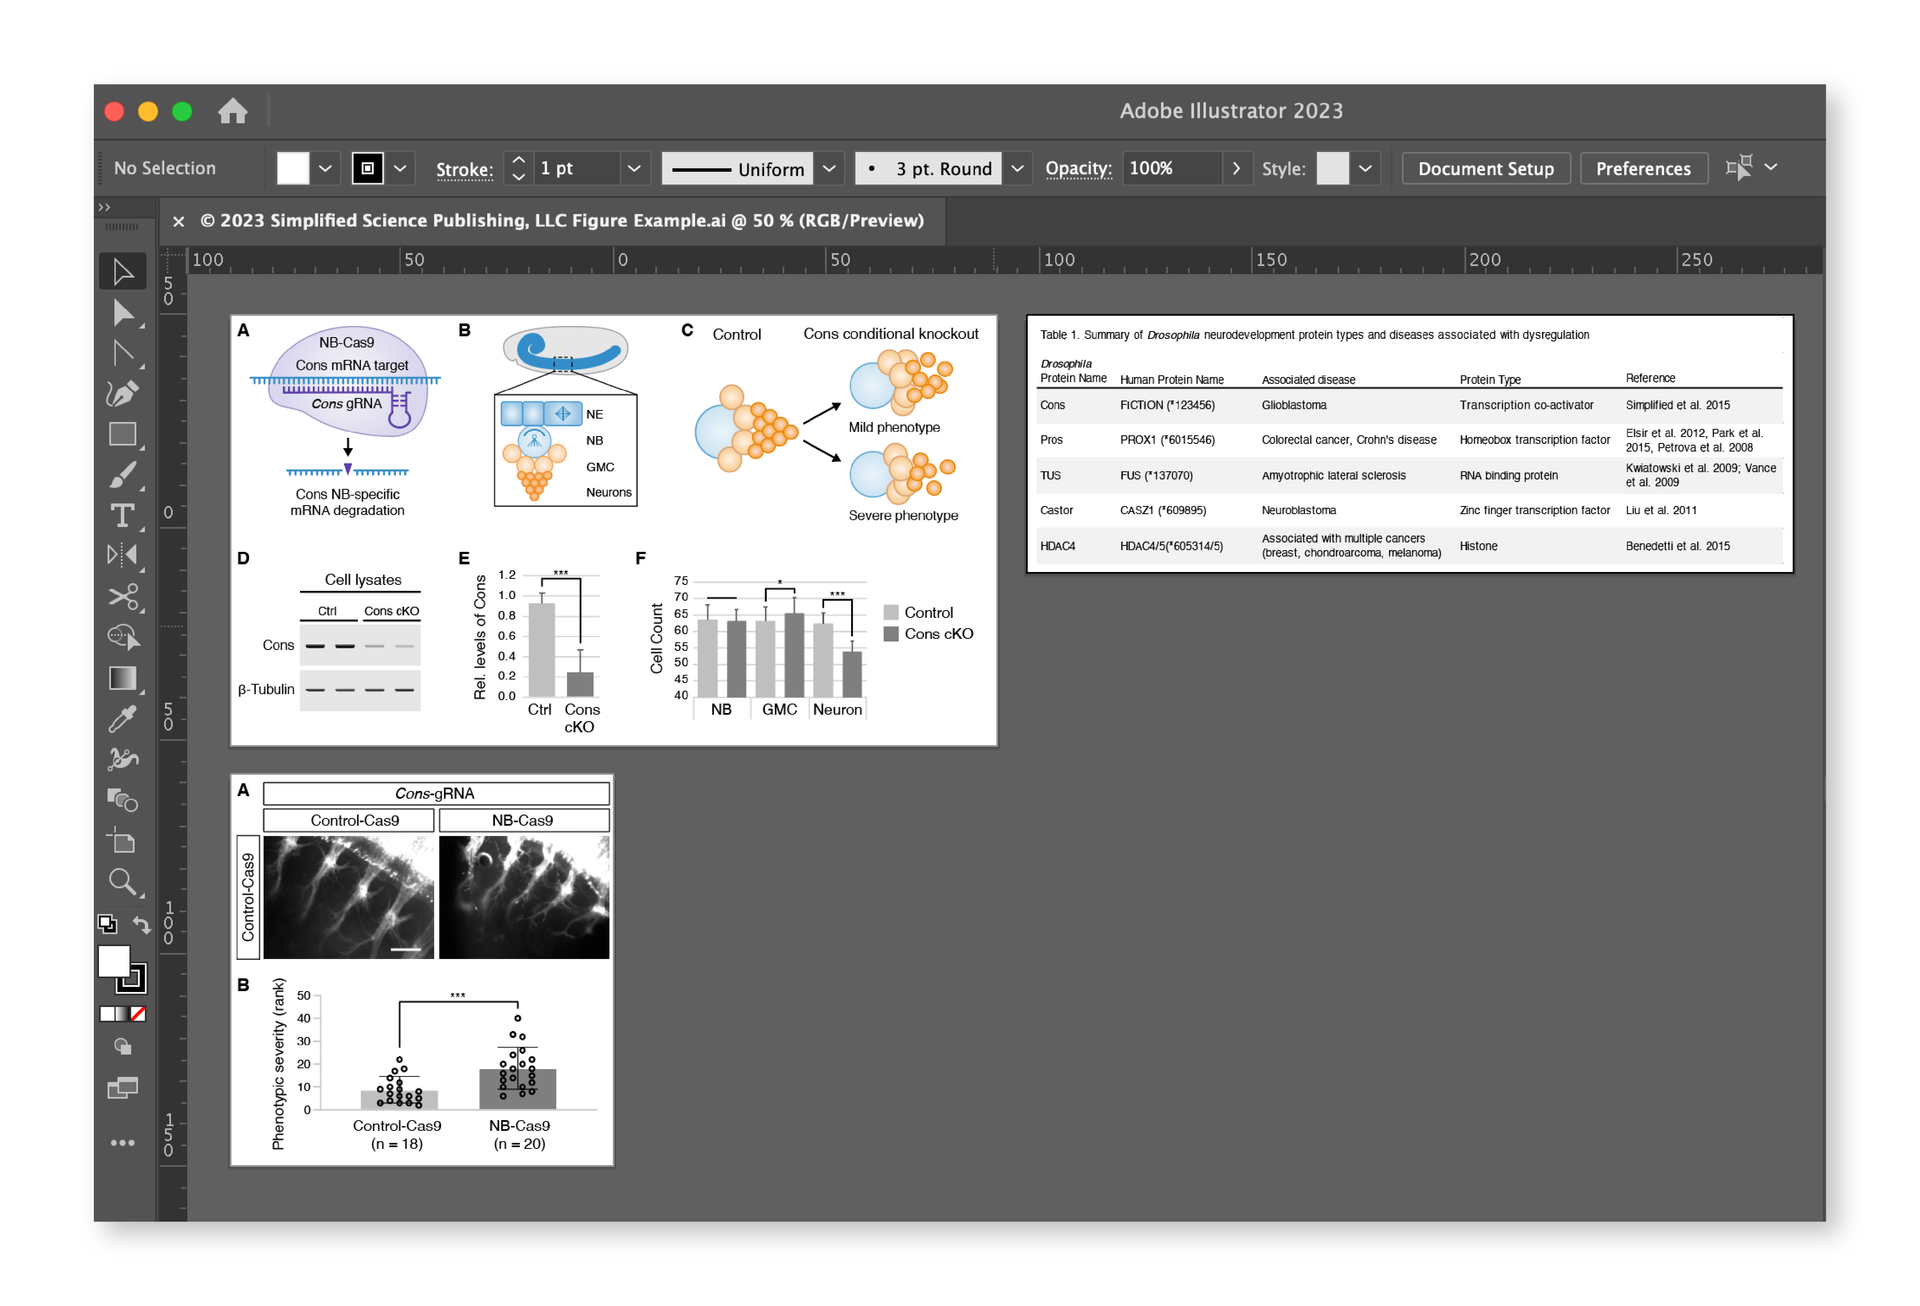
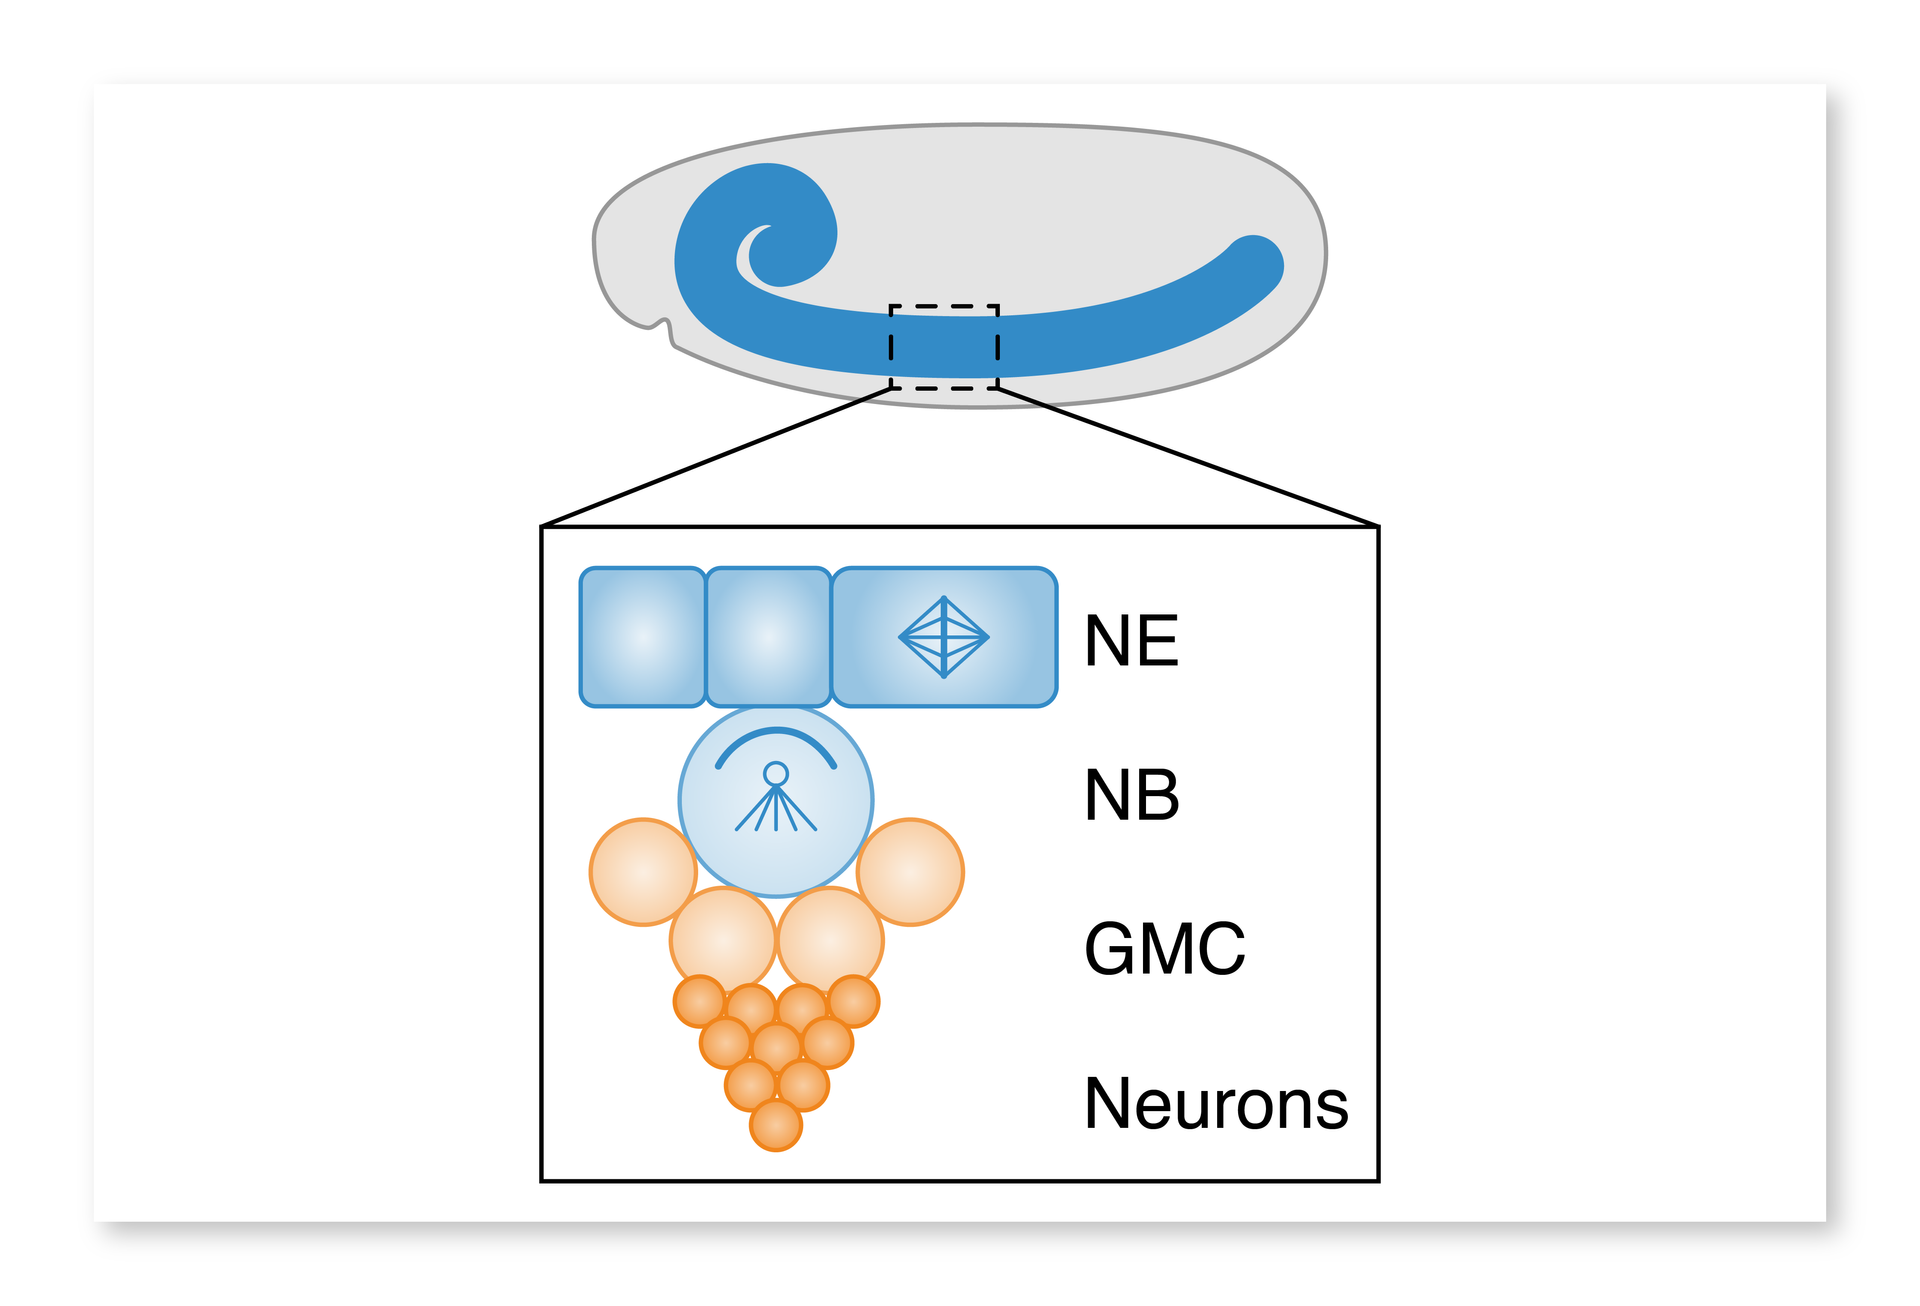
- Enjoy hands-on experience to create your own scientific illustrations for publications and posters
- Get expert tips on how to ethically optimize scientific images
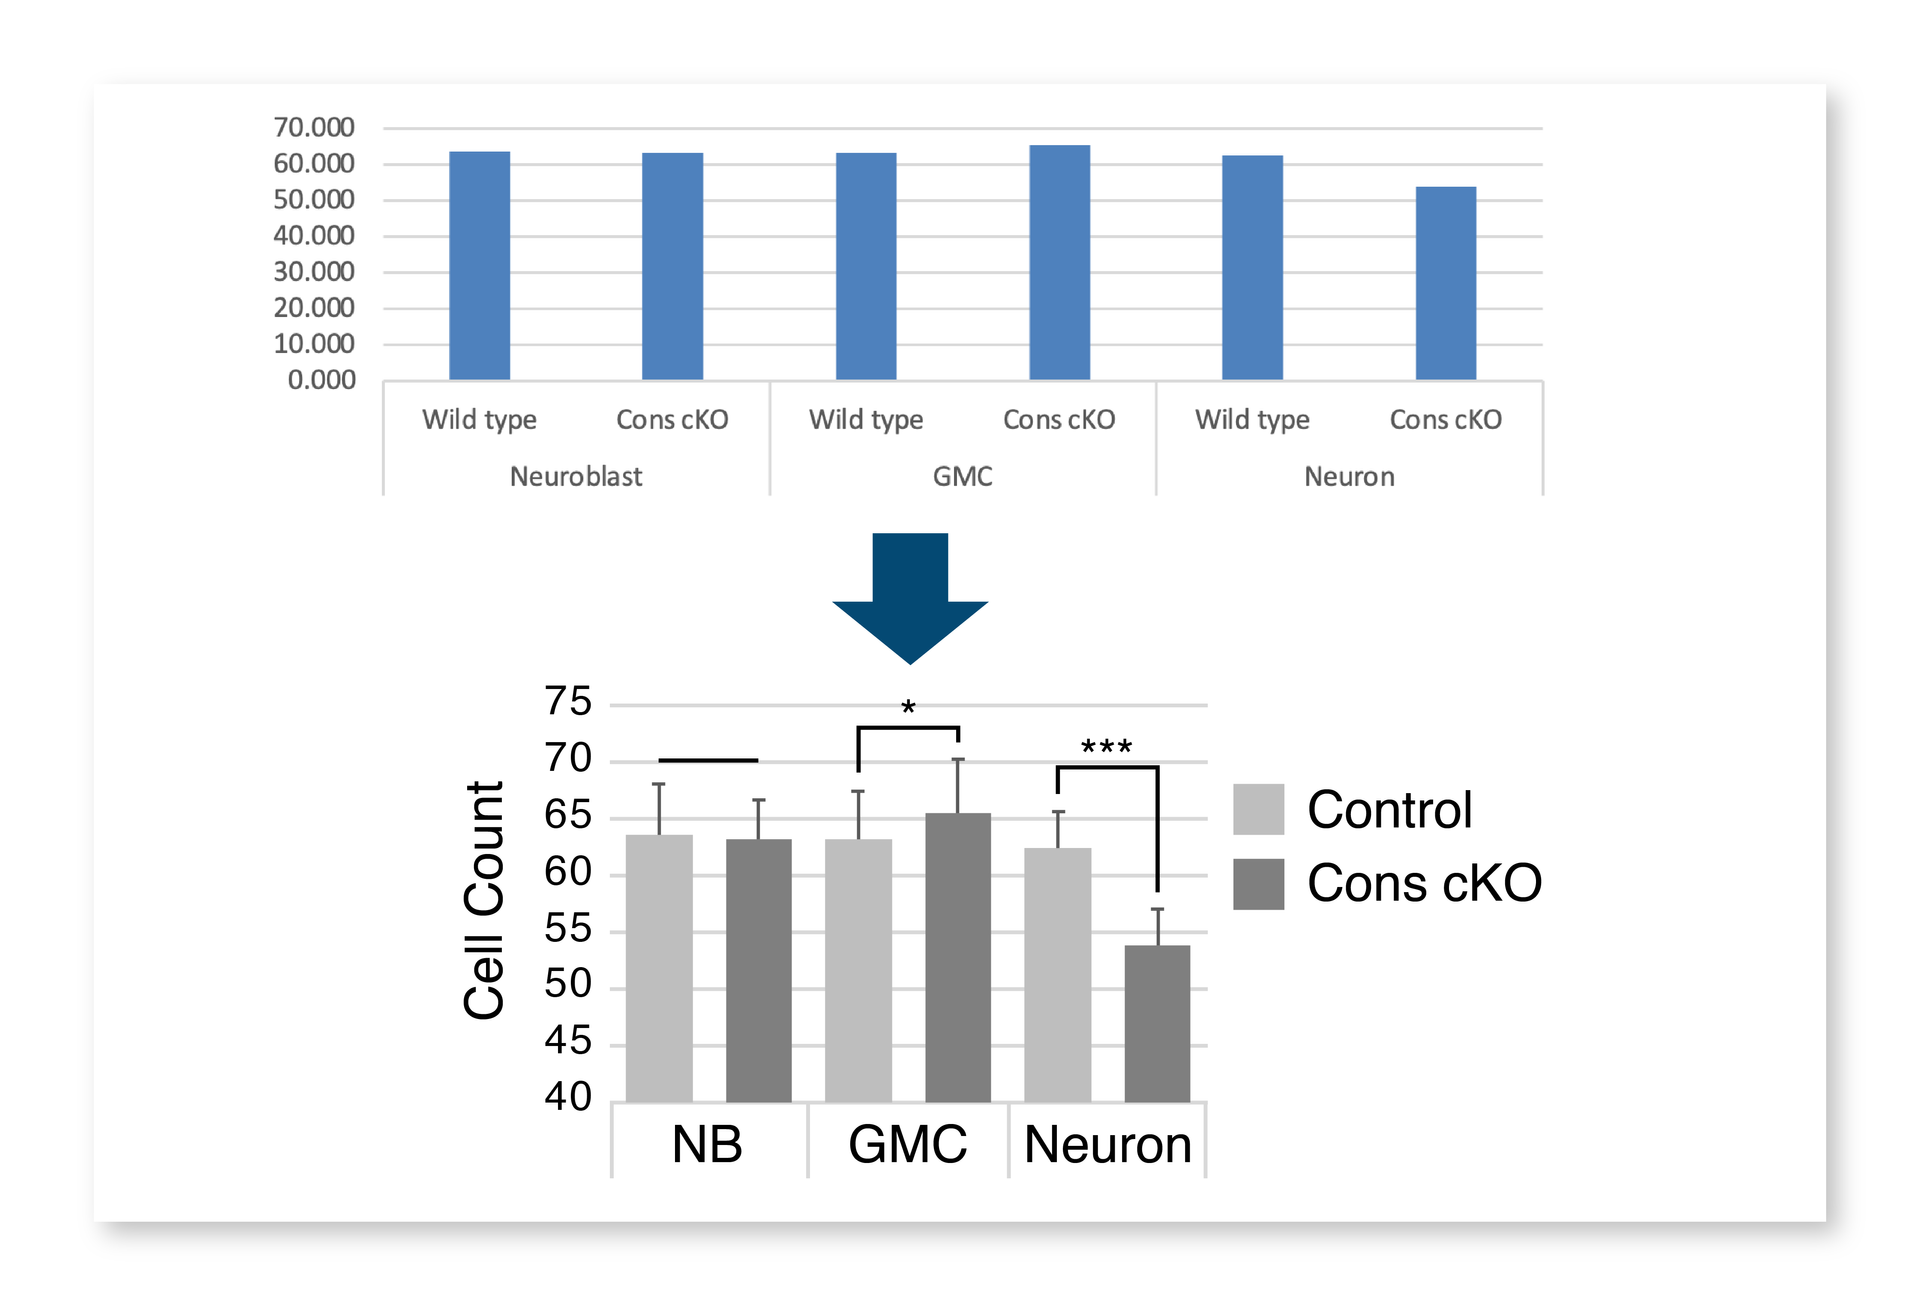
- Create data visualizations using Excel and other graphing software
- Export figures for publications, presentations, and posters
- Download illustration templates that make it easy for you to quickly make impressive graphical abstracts and figures
Beginner / 6 hours of tutorial videos with templates
This course is available with Simplified Science Pro where you will receive unlimited access to all of the courses and templates for $59/year.
Why Use an Adobe Illustrator Course?
Researchers use illustrations and diagrams to visualize the ideas behind their work. Whether it’s a figure for your next manuscript or a graphical abstract for your conference poster or grant proposal; having a key visual can improve your publication rates and enhance audience understanding.
Some scientists limit themselves by thinking they don't know how to draw, but this course is specifically designed to help anyone learn and apply the essential skills of vector illustration in Illustrator for research purposes. Join Dr. Karen Thiebes as she takes you through the step-by-step tutorials that will accelerate your ability to make professional illustrations and data visualizations for your research publications, presentation, and posters.
Course Instructor

Karen Thiebes is a professional scientific illustrator and has a Ph.D. in Neuroscience from Oregon Health & Science University. She has led scientific design courses for over 7 years and enjoys teaching participants how to quickly transform data into effective designs using Adobe Illustrator, PowerPoint, Affinity Designer, and Excel.
Explore the Course Chapters
Testimonials
""I’m happy to share that I’ve completed a new course: Introduction to Adobe Illustrator for Scientists. Thank you Karen Thiebes for your detailed online course, I can't wait to utilize your lessons in my current and future projects as an aspiring Scientific Illustrator!"
Ethan Warchol, Victoria University
"I absolutely loved the Adobe Illustrator class for Scientists! I had never used Illustrator before and I now feel way more confident and I am using it often for both my scientific and creative designs."
Alexia Caillier, Loyala University Chicago
Access All Advanced Online Courses
Sign up to receive access to all of the free and advanced courses for only $59/year. New online courses are added every year to stay up-to-date with the latest scientific design techniques and includes access to live trainings called Adobe Illustrator Learning Labs. The Pro courses also include scientific templates such as the popular Biological Diagram and Laboratory Tool Templates with over 400 illustrations that you can use in your own scientific designs (a value of over $95). Learn more here!