
LIVE ONLINE ZOOM WORKSHOP
Data Visualization Workshop
One or Two-Day Workshops
*Workshops can be customized to meet your team's career development goals
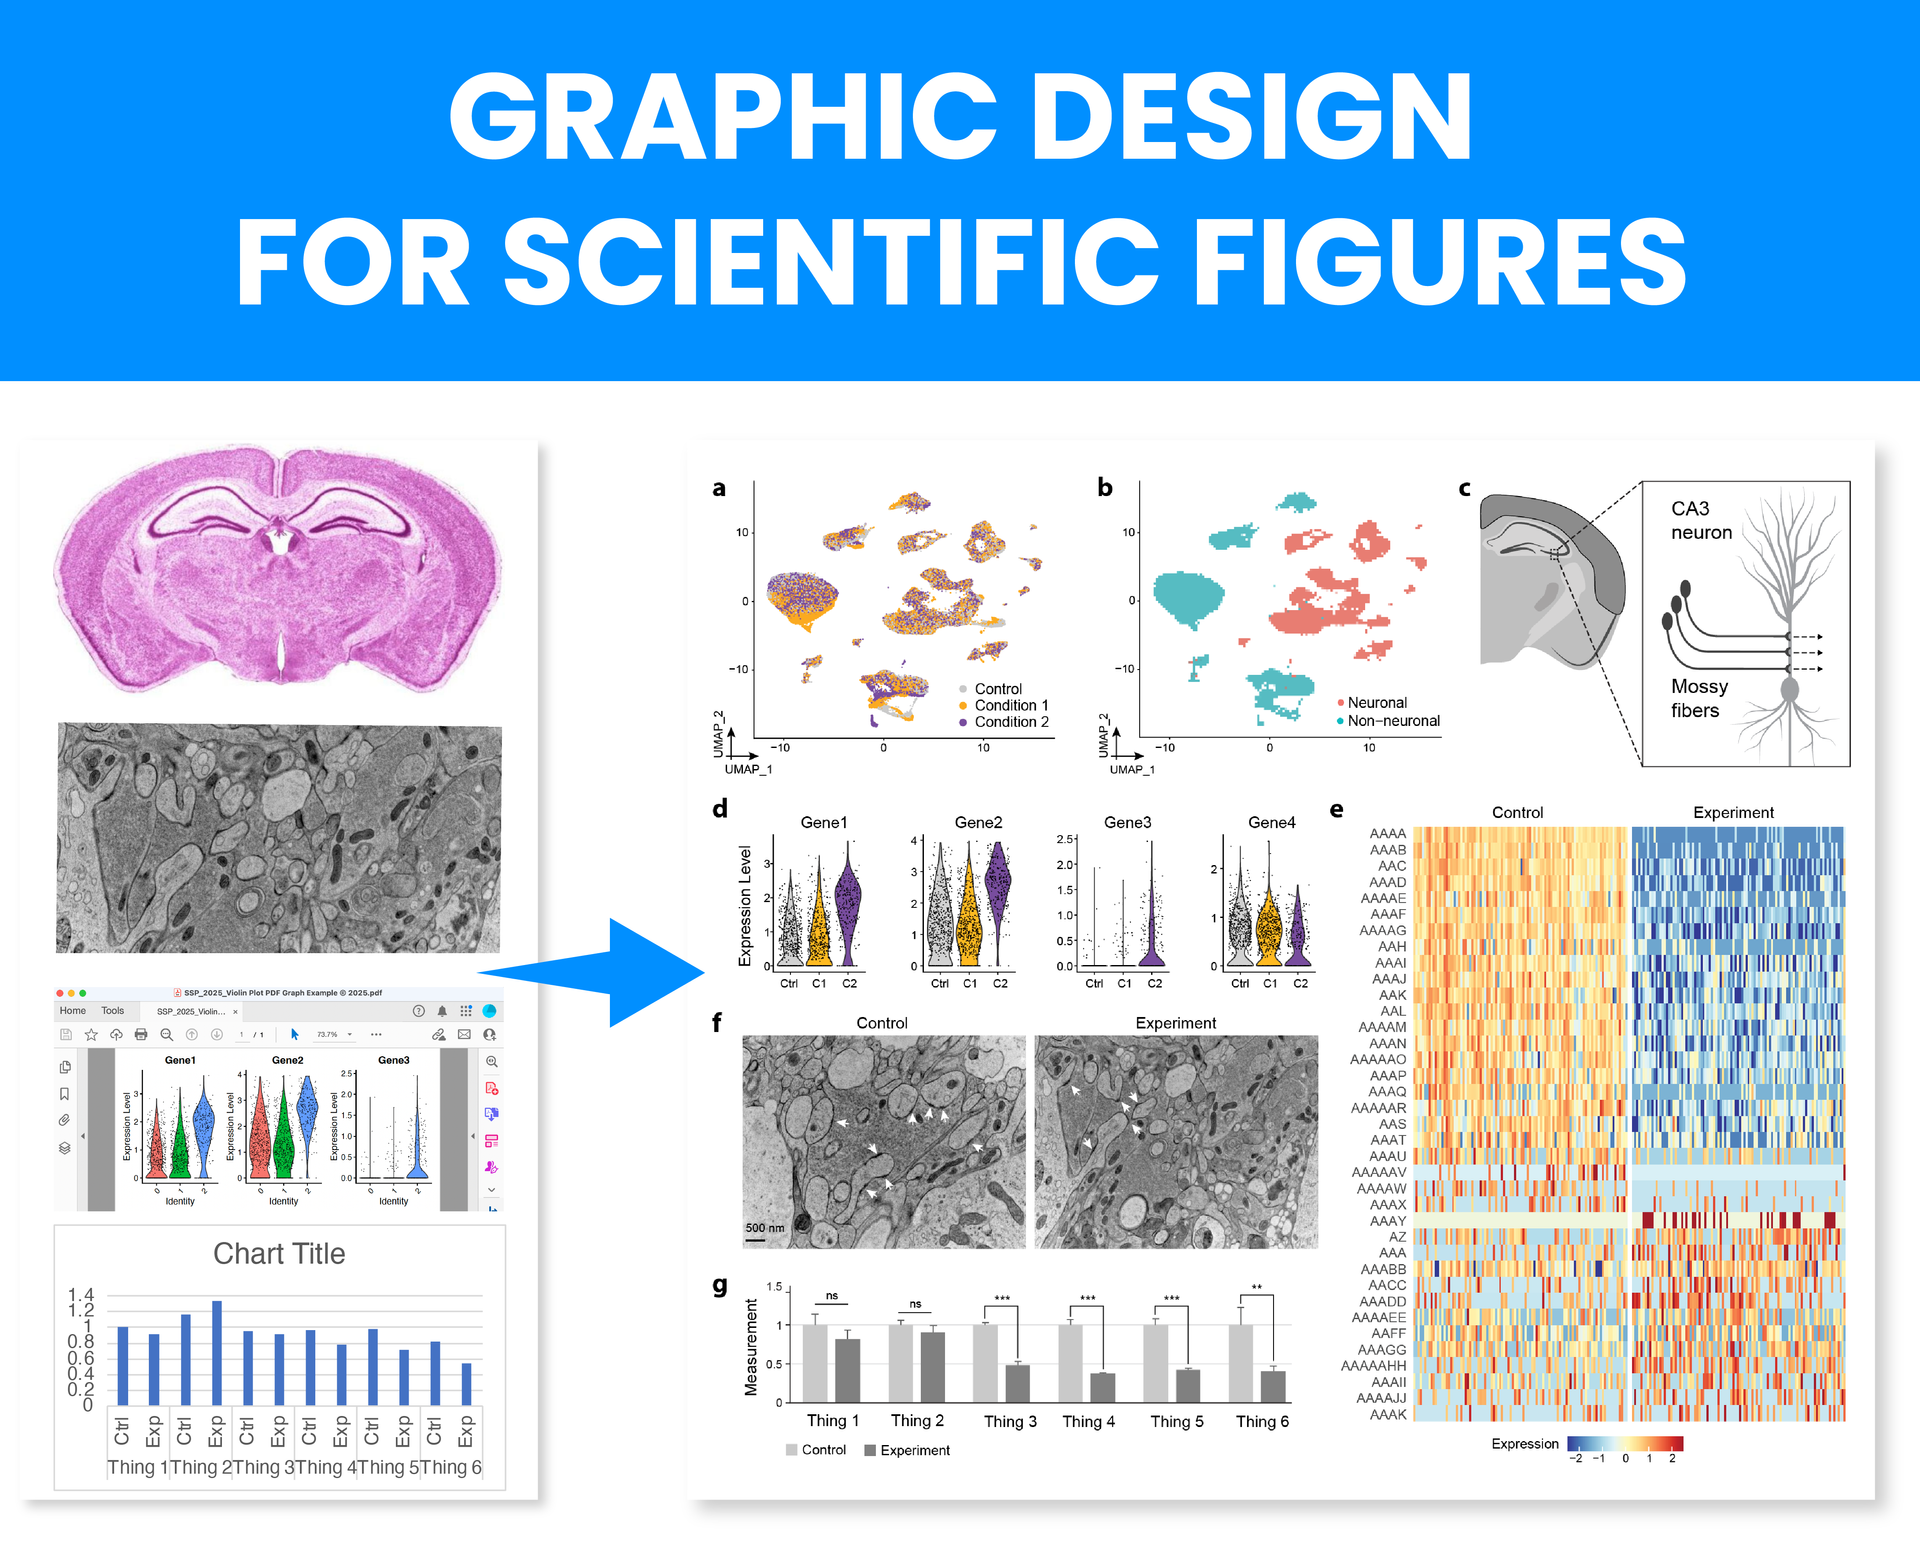
Learn how to make impressive visuals for high impact journals using the latest graphing and scientific design tools. Training covers graph formatting best practices, how to ethically edit scientific images, and design techniques for scientific illustrations. These workshops are great for research programs that want to provide their scientists with a competitive advantage for successful careers in academia as well as public, private, and nonprofit sectors.
Workshop participants will:
- Gain hands-on skills in scientific figure design with activities to optimize graphs, images, and illustrations for publications
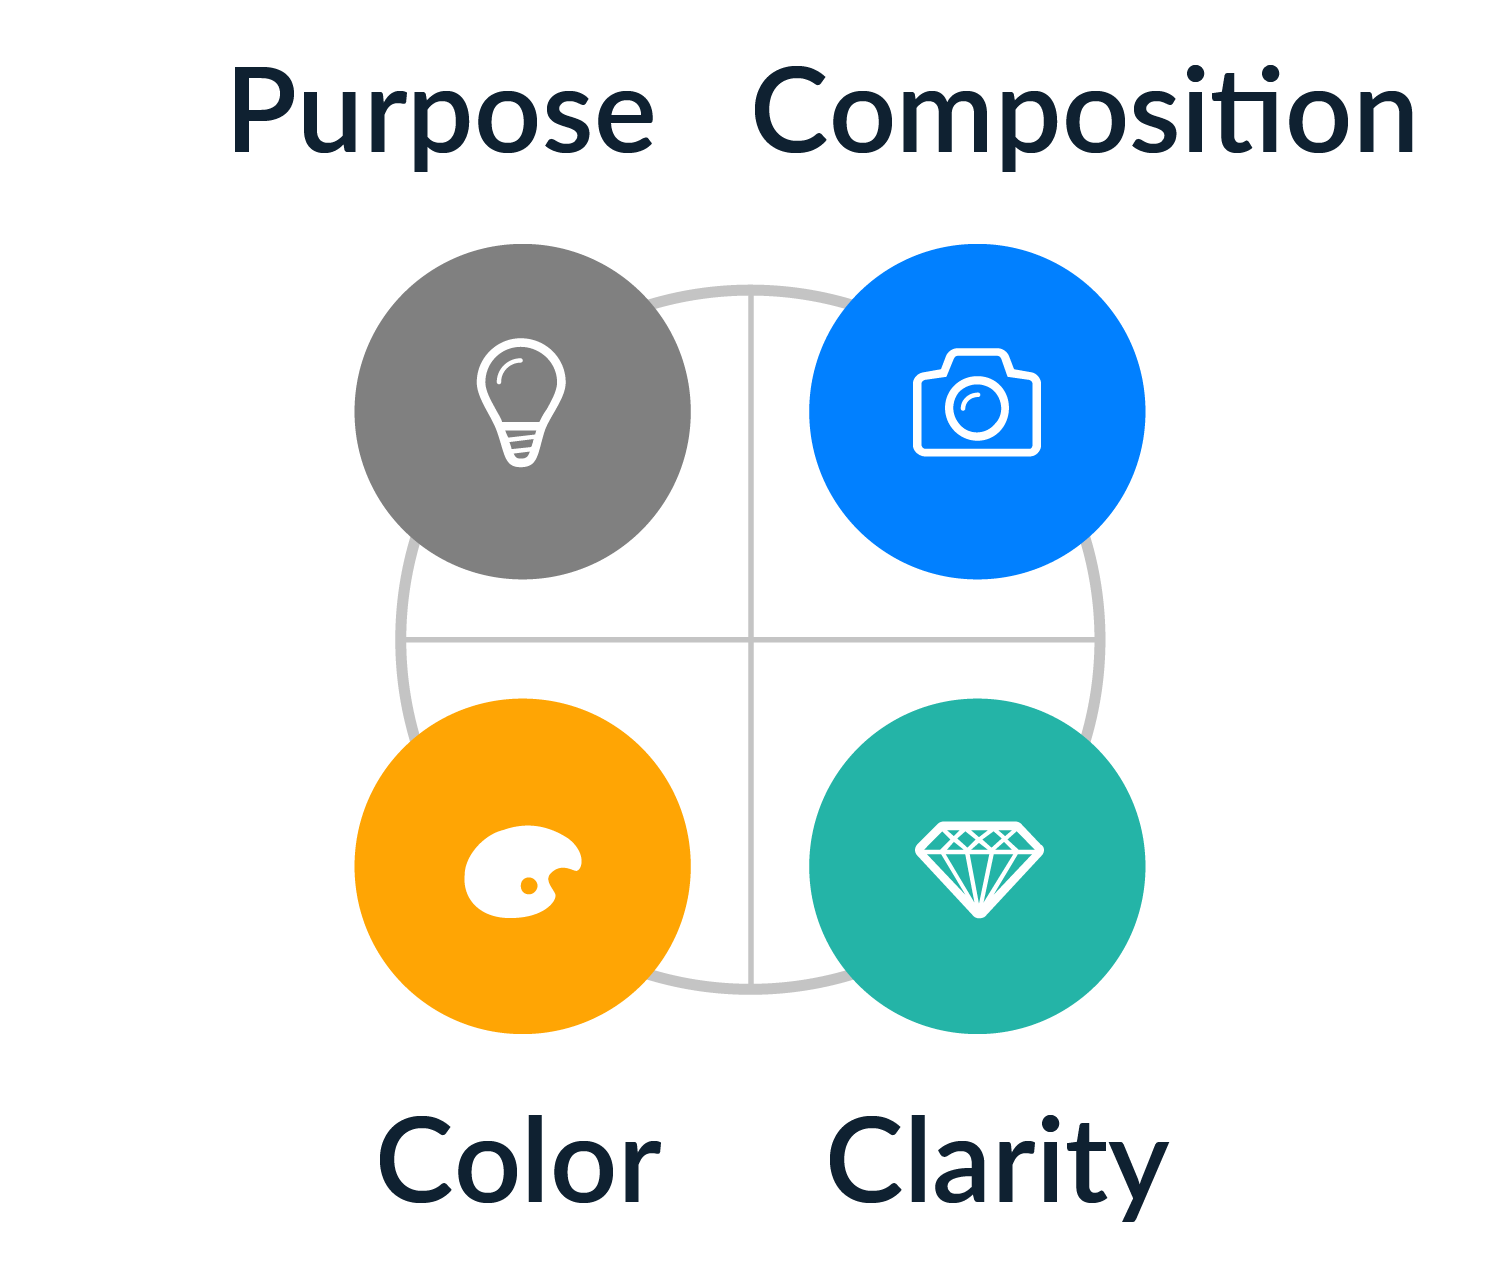
- Get expert tips on how to optimize the color design for their scientific graphs and presentations to improve accessibility and audience engagement
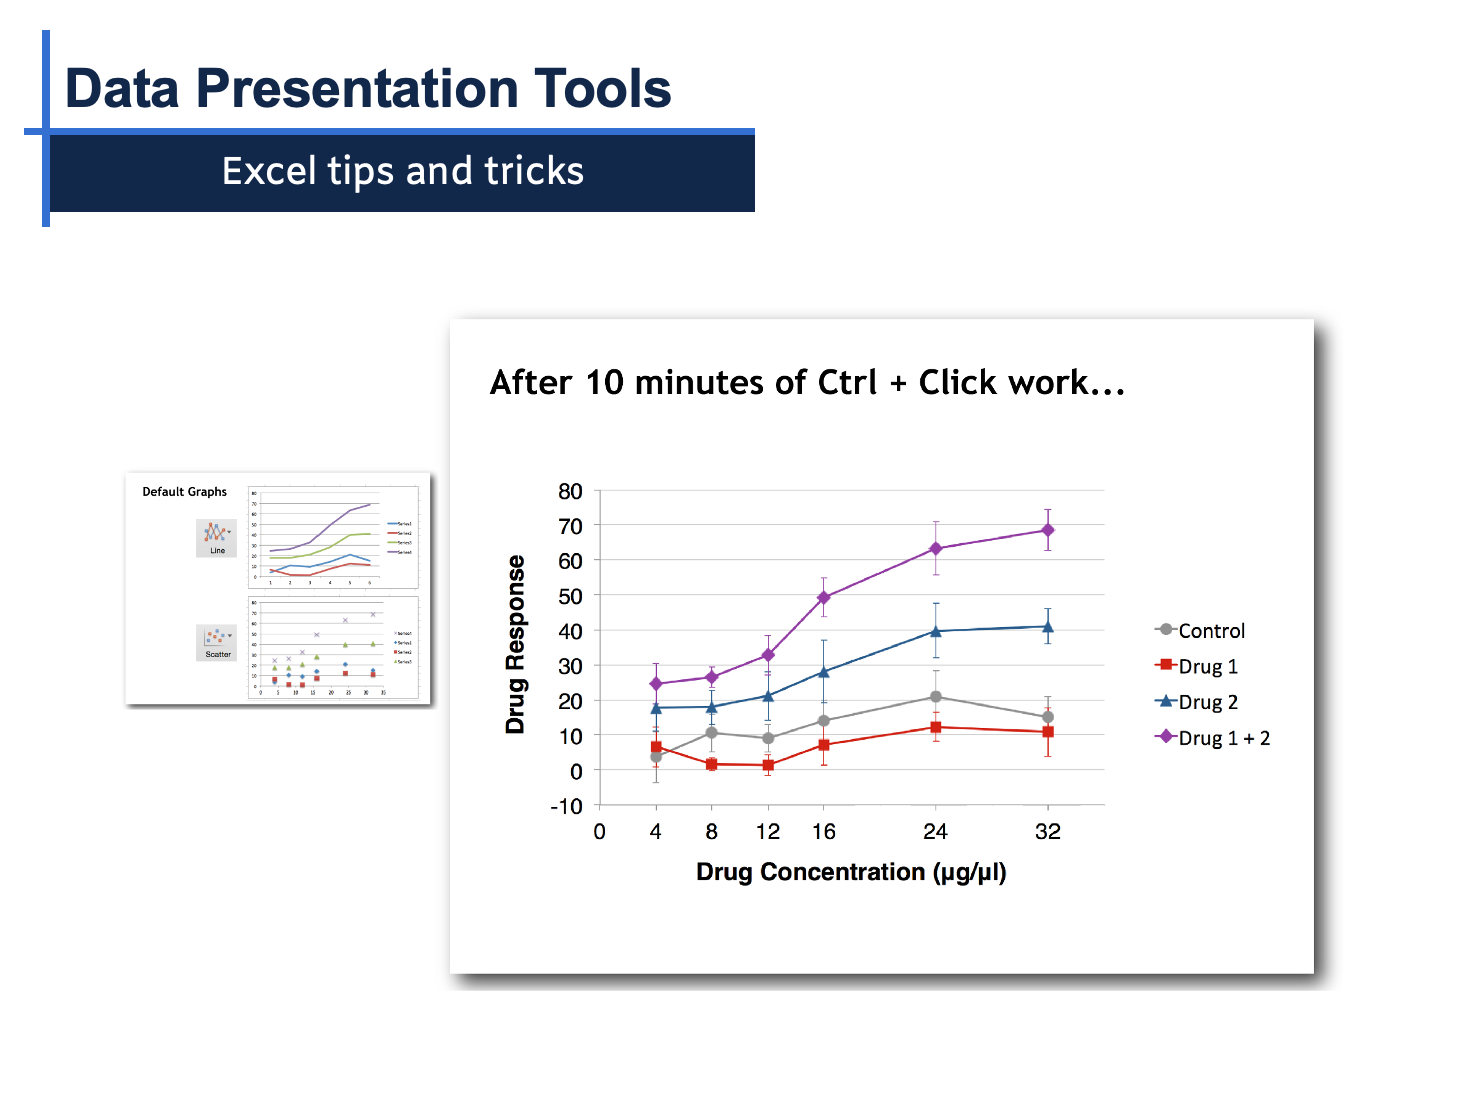
- Feel confident creating effective data visualizations using Excel and vector design tools such as Adobe Illustrator, Affinity Designer, and Inkscape.
- Learn about using the additional tools available for scientific design such as PowerPoint and Corel Draw.
- Receive user-friendly PDF guides with instructions that makes it easy to apply what they learned in the workshop without referring back to notes.
- Receive over 200 templates for scientific presentations, posters, figures, and illustrations that accelerate their ability to make professional designs.
Workshop Participant Reviews
I will apply the following one or two things in my role as a result of taking this class:
"I am looking forward to using both Illustrator, as well as the colour theory and professional practice that was discussed."
Danyan L.
"I can help my coworkers with the creation of figures and artwork for their posters and research papers. Having this as a skill I can now let my boss know I’m open to receiving tasks that are higher level such as participating in the creation of lab papers and posters."
Melodie N.
"Importing and adjusting image from PDFs.
Optimizing illustration colors."
David N.
"Using Adobe Illustrator to simplify and clarify figures for presentation.
Building posters for scientific presentations."
Casey T.

Course Instructor
Dr. Karen Thiebes is a professional scientific illustrator and has a Ph.D. in Neuroscience. She has led scientific design courses for over 8 years and enjoys teaching participants how to quickly transform data into effective designs using Adobe Illustrator, PowerPoint, Affinity Designer, and Excel.
Workshop Pricing & Request Form
Online Zoom Workshop Rates
- 1 hour workshop: $600
- 2 hour workshop: $800
- 4 hour half-day workshop: $1,000
*In-person daily workshop rates are the same as listed above with travel costs included as a separate fee.
Contact Us
Access All Advanced Online Courses
Simplified Science Pro users receive unlimited access to all of the free and advanced courses for only $59. New online courses are added every year to stay up-to-date with the latest scientific design techniques and includes access to live trainings called Adobe Illustrator Learning Labs. The Pro courses also include scientific templates such as the popular Biological Diagram and Laboratory Tool templates with over 400 illustrations that you can use in your own scientific designs. Learn more here!